Why a Star Chart Turns a Curved Sky into a Flat Page
A star chart projection changes apparent spacing and shape; learn how to read the page without mistaking its geometry for the sky overhead.
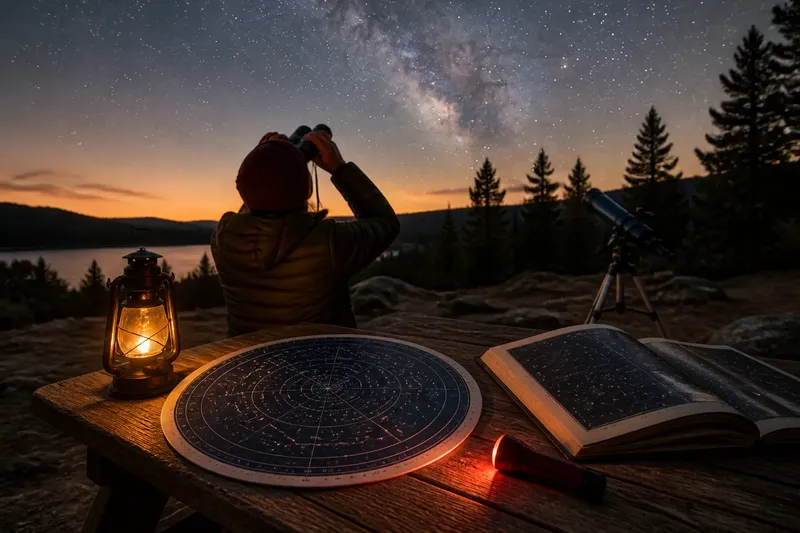
You spread a star chart on a picnic table, look up, and notice that the pattern above seems broader than the little cluster printed near the page edge. The stars have not shifted: the chart’s projection has translated a curved sky onto a flat surface, changing how some distances and shapes appear. Knowing where those changes come from makes the page easier to use at the eyepiece or under an open sky.
Mapping a curved dome
From a single observing spot, the sky appears like a dome around you. A star chart usually represents the celestial sphere, an imaginary shell surrounding Earth, as a flat map. That conversion resembles flattening a peel: some regions must stretch, compress, or distort for the surface to lie flat.
On Earth maps, familiar coastlines can look different depending on the projection. Sky charts face the same basic problem, though their purpose is to show positions on the celestial sphere rather than land. A projection chooses which properties to preserve and where to accept distortion.
Some charts are circular and centered on a celestial pole; others show a rectangular strip of sky. A planetarium app may redraw the view as you change direction, while a printed atlas keeps one fixed projection. Neither format is a miniature photograph of the sky. Each is a coordinate map with a particular way of handling curvature.
What projections preserve
A projection can preserve certain relationships better than others. One may keep directions from a chosen center accurate, while another may preserve local angles or make coordinate lines easier to follow. No flat map can preserve every distance, area, angle, and shape across the whole sky at once.
This is why a constellation near a chart’s center may look familiar, while one near the edge appears stretched. In a common pole-centered chart, the celestial pole sits near the middle and the equator forms a distant outer boundary. Regions farther from the center can spread outward, so shapes and apparent gaps may change noticeably.
Rectangular charts bring their own trade-offs. Lines of right ascension and declination, the sky’s counterpart to longitude and latitude, can form a tidy grid, but the map’s edges may distort shapes. A straight line on the page is not necessarily the shortest route between two stars as seen on the celestial sphere.
Scale and apparent spacing
Scale tells you how a map distance relates to a distance on the sky, but a single scale bar may only apply locally. Near the center of a projection, a finger’s width on the page might correspond to a different angular span than the same finger’s width near an edge. Treat printed spacing as a guide, not a promise that every interval is uniform.
Star charts also use symbols to show brightness. A larger printed dot usually represents a brighter star, not a larger object or a star physically closer to its neighbor. The marks are visual shorthand, and the projection controls where they sit while the symbol size communicates a separate property.
Say you are using a round chart centered on the North Celestial Pole to locate a group of stars near the outer rim. The group may look stretched and its stars seem farther apart than they do overhead. Use the chart to recognize the sequence and direction of the pattern, then compare the whole group in the sky rather than judging its shape from the page alone.
Reading a chart outdoors
Before matching a printed map to the sky, check its orientation. Some circular charts are designed to be held overhead, with the direction you are facing aligned to the chart’s edge; other maps use north at the top and need to be turned to match your view. The legend or instructions explain the intended convention.
Start with a broad anchor, such as the horizon direction, a bright star, or a recognizable constellation, then move toward the target. This approach relies on neighboring relationships rather than exact paper distances. If you use an app, confirm that its compass and location settings are sensible; a nearby building or magnetic interference can make the displayed direction misleading.
For a printed chart, a red flashlight can help preserve dark adaptation while leaving labels visible. Keep the page close enough to read, but glance up often: the chart is a reference, not a substitute for looking. If the paper is rotated or held at a different angle, the apparent shape may change even though the stars’ positions relative to one another remain fixed on the celestial sphere.
Which chart suits the task?
A wide-field planisphere is handy for identifying what is above the horizon at a given time, while a detailed atlas can help locate fainter objects within a smaller region. A planetarium app makes it easy to rotate and zoom, though its screen can compete with faint stars unless dimmed. Pick the format that fits the question you are asking, and read its projection and orientation notes before relying on fine spacing.
For a quick comparison, look at the same constellation in a pole-centered chart, a rectangular atlas, and an app view. Notice which version keeps the group compact and which stretches it. That difference is not an error; it is a consequence of representing a curved surface in different ways.
Questions about star charts?
Why does a constellation look stretched?
Its position on the chart may be far from the projection’s center, where distortion is stronger. The stars’ actual arrangement in the sky has not changed; the map has altered their apparent spacing or shape to fit a flat page.
Are chart distances accurate?
They can be useful locally, but a chart’s scale may vary across the page. Use nearby stars and directions to estimate a route, and avoid treating a ruler measurement as an exact angular separation unless the map specifies a suitable scale.
Why does a chart need turning?
The chart may be drawn with north at the top, while you are looking toward another direction or holding it overhead. Rotate it so its directions match the horizon and the view in front of you.
Does an app remove projection distortion?
No flat screen can show the entire celestial sphere without some distortion. An app can change its view as you pan or zoom, making a smaller region easier to inspect, but the chosen projection still affects how the sky appears on screen.
Let the sky settle it
A star chart projection is most useful when you know what it is designed to preserve and where it may stretch the view. Read its orientation, use broad landmarks, and treat spacing near the margins with care. When a printed pattern looks odd, compare it with the stars themselves before concluding that the chart—or your eyes—is wrong.